

Table of Content
Are you making decisions more on intuition rather than based on facts due to the unavailability of real-time data?
Do you have a backlog of analytics projects?
Are you bogged down with the manual and time-consuming reporting process?
If these resonate with you, it’s likely that you are currently using a combination of solutions, including various data handling tools from other vendors, homegrown tools or spreadsheets, to access, manage and present your data. This approach not only compels you to invest a lot of time and money to achieve your desired goal but also hinders your ability to thrive in this cut-throat competition.
Having said that, we are not suggesting that you remain stressed about your ability to succeed in this dynamic world, instead asking you to look beyond your current capacity by embracing modern technology.
Yes, you heard it right. Today’s technology, like Microsoft Power BI, revolutionises the whole data management and presentation process to foster a data-driven culture. With Power BI, Microsoft offers business intelligence solutions that enable its customers to democratise data analytics and gain insights more quickly.
Forrester Consulting conducted a survey and found out that on average, using Power BI saves 1.25 hours per week, with a total cost savings of $2.3 million over three years. These figures are quire compelling, aren’t they?
If you also want to be part of this club, then it’s time to consider investing in this advanced solution. We understand that investment decisions are not easy; therefore, here we are with a detailed blog to provide you with comprehensive information about Power BI solutions to help you make an informed decision.
What is Power BI?
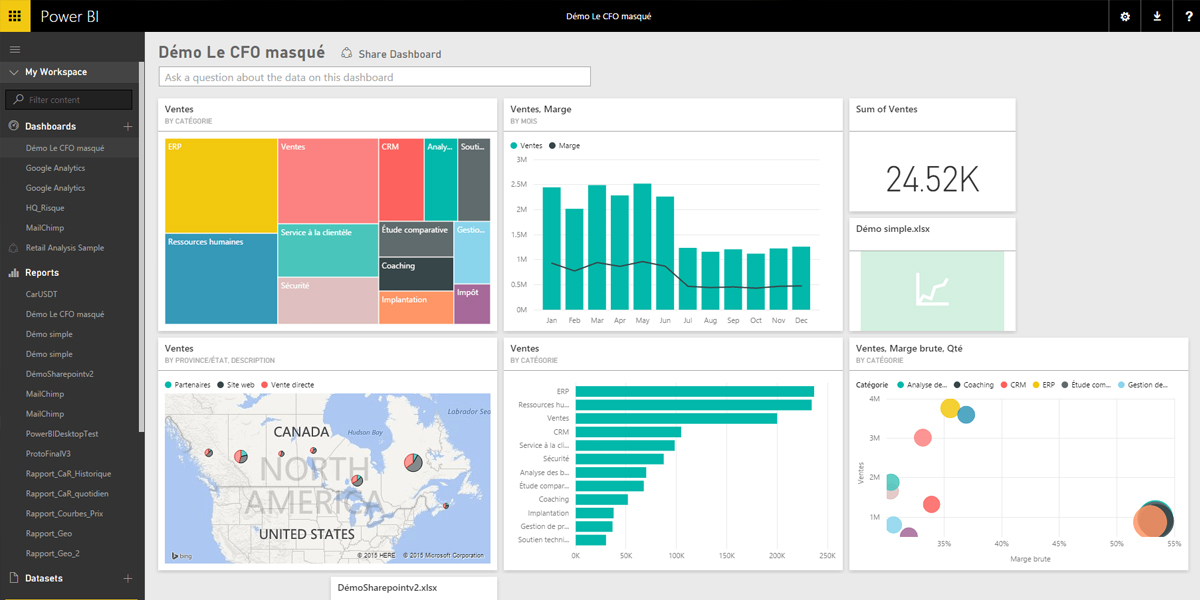
Power BI is a tool that brings together software services, applications and connectors to transform various data sources into clear, interactive visual insights. Whether your data is in an Excel file or a mix of cloud and on-premises data warehouses, Power BI helps you easily connect to your data, visualise what’s important and share it with others.
Power BI is composed of several integrated components, starting with these three core elements:
i. Power BI Desktop: A Windows desktop application
ii. Power BI Service: An online software as a service (SaaS) platform
iii. Power BI Mobile Apps: Available for Windows, iOS, and Android devices.
These three core components, Power BI Desktop, Power BI Service and Power BI Mobile Apps are made to help businesses create, share and use business insights easily, tailored to their specific role and needs.
In addition to these three, Power BI has two more components:
i. Power BI Report Builder: It is used to create detailed reports that businesses can share in the Power BI service.
ii. Power BI Report Server: It is a report server business can use on-site to publish reports made in Power BI Desktop.
Unveiling Insights: Industry Obstacles Pre-Power BI Implementation
Are you unable to understand what is stopping your business growth? Is it difficult to access and analyse information effectively due to the fragmented data across your departments? In this modern business dynamic, making the right business decisions at the right time can spell the difference between success and stagnation.
Therefore, if the below-mentioned challenges are familiar to you, you will know where you are making the mistakes. However, there’s no need to worry, as alongside highlighting these business challenges, we will provide tailored solutions to help you navigate them effectively.
1. Absence of Real-Time Statistics :The inability to obtain data from a colleague or the necessity of searching through numerous server reports generally delays business decisions. Waiting for data reports is no longer acceptable in this advanced business landscape, as it can hinder business growth.
2 . Error-Prone Data Sharing :The practice of sharing data-laden documents with the team carries a high potential for human error due to the lack of collaboration features. Documents stored in a cloud environment are prone to mislabeling, unintended modifications, and accidental deletion. The process of locating reports within this framework often demands significant time investment. Such obstacles can result in unnecessary errors and setbacks.
3 Report Preparation Challenge : The process of preparing presentations, whether it’s for investor meetings, updating shareholders or conducting internal sessions, can be quite labour-intensive. Apart from gathering relevant data, there’s a challenge of translating information into visually engaging presentations. Incorporating charts, graphs, and images adds to the time investment needed. Additionally, once the presentation is ready, the data may have already become outdated.
4 Lack of Foresight Predicting and understanding future trends pose challenges even for the most accomplished businesses. Successful business operations hinge on anticipating potential scenarios based on logical assumptions and accordingly making appropriate preparations. Ultimately, a business that lacks foresight and strategic planning is destined to decline and vanish.
5 Data Security Risks Data volumes and analytics requirements are growing over time. Without proper governance capabilities, businesses may struggle to maintain data accuracy, security and compliance, leading to data integrity and privacy risks.
What are the Robust Capabilities of Power BI ?
How can organisations become more efficient and unlock their growth potential? By fostering a data-centric culture, right? Forrester reports that companies leveraging data for insightful decision-making are nearly three times more likely to achieve double-digit growth.
Harnessing Power BI’s data integration, visualisation, and advanced analytics enables businesses to gain crucial insights, optimise campaigns and foster growth. Power BI empowers businesses to thrive in this competitive landscape with real-time analytics, leading to strategic data-driven decisions.
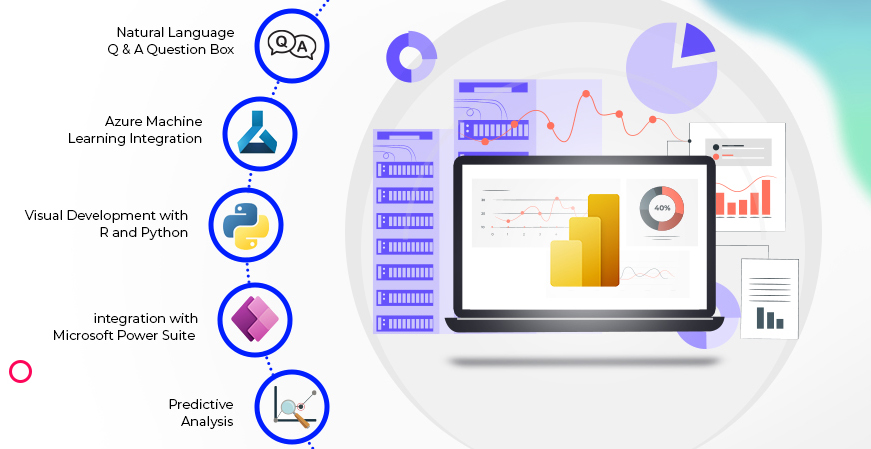
Unlock Insights with AI Capabilities
Convert your data into visual representations using cutting-edge data analysis tools, AI capabilities and an easy-to-use report generation tool.
Centralise Your Data Sources
Generate datasets from various sources and integrate them into the OneLake data hub to establish a single source of truth for your data.
Transform Insights into Effective Actions
Enhance decision-making for users by integrating insights into the everyday applications you utilise, such as those within Microsoft 365.
Equip Your Data Team
Transform how your organisation accesses, manages and responds to data by incorporating Microsoft Fabric into your Power BI workflow.
These robust capabilities of Power BI empower businesses to perform various essential tasks accurately and with ease to enhance business productivity. Below are some of the crucial tasks performed using Power BI.
Centralised, Authoritative Data Source Creation
Allows you to integrate various data sources within a unified environment to establish a singular, reliable source of data for your organisation.
Combine Enterprise-Scale and Self-Service
Helps you to integrate enterprise-scale and self-service capabilities to foster insights and innovation across all organisational levels.
Embed Data Experiences Across All Platforms:
Empowers you to seamlessly connect insights with decisions through the integration of everyday applications people rely on.
Enable Everyone to Engage with Data
Provides you with an intuitive interface, comprehensive training resources and diverse accessibility features to facilitate data exploration for all.
Start Instantly
Empowers you to launch promptly with a user-friendly report creation process, AI-generated reports and a wide selection of report templates.
BI Report Integration for Your Customers
Allows you to enhance usability and user engagement within your applications though the utilisation of Power BI Embedded to integrate impactful reports.
Power BI and Microsoft Fabric Synergy
Microsoft Fabric brings together data and services in one unified platform, making it easier to perform analysis and analytics on various data sets. Power BI is one of the integrated services, and OneLake is an example of data that can be used.
Large organisations benefit from Microsoft Fabric as it organises extensive data stores and leverages services like Power BI to turn data into actionable business insights.
Administration of Power BI is now under Microsoft Fabric, but you can still use familiar tools like Power BI Service and Power BI Desktop as usual. These tools convert your data, whether in OneLake or Excel, into meaningful business intelligence insights.
How Power BI is Transforming Your Data Game?
Businesses that aim to stay ahead in today’s competitive market have discovered how to use their data effectively to make smart decisions that foster innovation throughout their organisation. Power BI empowers employees of all levels to make informed choices using real-time analytics.
Power BI consolidates data from various sources to build engaging, interactive dashboards and reports. These tools offer actionable insights that drive business outcomes.
Business Growth with Enhanced Analytics
The timely and accurate report analysis enables businesses to increase revenues, decrease operating costs and accelerate entry into new markets. The financial model indicates an improvement in operating income driven by revenue growth and reduced operational expenses.
Save Time
One of the important benefits is that Power BI users experience time savings through quick access to crucial information. The improved efficiency across various business roles eliminates the need to wait for reports or for the completion of data analytics projects by a centralised team.
Reduced Total Cost of Ownership (TCO)
Since Power BI makes data analytics more accessible to everyone in the organisation, it promotes data democratisation. This inclusive approach empowers anyone in the business to engage with data and derive valuable information without needing to expand the central data analytics team. Also, it eliminates the reliability of other vendor solutions required pre-implementation of Power BI. Therefore, the use of Power BI leads to a reduction in the total cost of ownership.
Enhanced Security
Power BI empowers businesses to improve their security and compliance by addressing issues like data segregation to prevent unauthorised access. It strengthens overall data security and facilitates internal and regulatory compliance efforts.
What is the Pricing Structure of Power BI ?
Power BI is a part of Microsoft Power Platform, and like other Microsoft products, it also offers subscription-based licensing and pricing options. There are different types of Power BI pricing plans available tailored to your different business requirements. Notably, you can start with a free Power BI account if the need is to generate rich, interactive reports using visual analytics.
Power BI Pro: The license subscription option is available for $15.00 AUD per user/month. It provides you access to the shared Power BI reports with you and allows you to publish your own reports to enhance your impact.
Power BI Premium: The license subscription option is available at $29.90 AUD per user/month. It offers the advanced, large-scale features required for enterprise-level business operations.
Power BI in Microsoft Fabric: The pricing of this license subscription option is variable. With this subscription, you can share your reports with any user who has access to Microsoft Fabric workloads using a single capacity but doesn’t have paid licenses.
Note: It is important to understand that the prices shown here don’t include GST.
| Power BI Free Account Features | Power BI Pro Features | Power BI Premium Features | Power BI Embedded Features |
| 1. Available with a Microsoft Fabric Free Account | 1. Allows you to publish and share Power BI reports | 1. Comprises all the features offered by Power BI Pro | Allows you to customise Power BI reports with your own branding |
| 2. No requirement for credit cards | 2. Available in Microsoft 365 E5 and Office 365 E5 | 2. Grant you access to larger model sizes . | 2. Empower you to automate monitoring, management and deployment |
| 3. To share reports, upgrade to Pro or Premium | 3. You can purchase it now with credit cards | 3. Provide frequent refreshes | 3. Minimise developer workload |
| 4. You can purchase it now with credit cards |
Case Study Power BI
Business Intelligence for Advanced analytics
Client Overview: Company: ABC Group Industry: Financial Services Location: Australia Employees: 250 Annual Revenue: $70 million AUD Background:
ABC Group, a mid-size financial service company, had been using fragmented solutions to manage their data. Over time, the company faced several challenges with the system performance, scalability and lack of modern features. Therefore, they decided to invest in the powerful Power BI solutions to overcome the challenges for unconditional business growth.
Challenges:
1. Fragmented Data Analysis Solution Hindering Business Growth The company’s previous solution failed to provide the employees with the necessary information at the correct time to succeed in their roles, impeding informed decision-making.
2. Growing Need for Data The current data analytics team were unable to keep up with the rise in demand for data as the business grew, and hiring significantly more staff to perform this job wasn’t a viable option for the company.
3. Lack of necessary features The company’s fragmented legacy solutions resulted in limited features and insufficient scalability to accommodate the growing business needs. These solutions came with high license costs and required frequent expensive upgrades. Due to the slow upgrade process, the solutions lacked the latest data analytics capabilities by the time the upgrades were finished.
Main Factors that Compelled to Invest in Power BI
1. The necessity to produce better quality and actionable insights
2. Time-consuming and ineffective manual/paper-based processes
3. Minimise the reliance on complex, fragmented systems
Outcomes
1. Enhance the decision-making capability of the business and increase its agility with advanced real-time analytics. It leads to improved cash flow, quick time-to-market of new products, maximised sales and improved customer satisfaction.
2. Democratising data enables users to access it at the time of their requirement from anywhere, which ultimately saves a lot of time. The user-friendly approach empowers more people to perform their own analysis and create their own reports, leading to eliminating IT bottlenecks and fostering creativity and agility.
Benefits
1. Improved customer service
2. Enhanced productivity of the IT team
3. Quick solution quoting
4. More revenue generation
5. Quick time-to-market with new services
Client Testimonials “We are very satisfied that Power BI helps us to make lending decisions in minutes. This efficiency not only leads to many new loans annually but also helps us to accelerate the launch of new products and services.”
Conclusion
How you employ Power BI hinges on your role in the organisation. For instance, using the Power BI service may be central to viewing reports and dashboards. Sales professionals might rely on the Power BI Mobile application to track progress on sales quotes and explore new sales lead details. Developers could utilise Power BI APIs to integrate data into semantic models or embed customised dashboards and reports in their applications.
Depending on the task at hand in your specific role, you may utilise different aspects of Power BI as needed. Your approach to using Power BI is determined by selecting the feature or service that best fits your requirements.
Therefore, to understand which Power BI subscription option of Power best fits your business requirements, contact our experts at Dynamics Square.
Our Power BI experts at Dynamics Square will always be at your service to provide you with tailored solutions.
Start your digital transformation journey today.


Witness a Scalable Transformation
Experience real-time synchronisation and flexibility with a consistent view across your business.
Disclaimer– “All data and information provided on this blog is for informational purposes only. Dynamics Square / MPG Business Information Systems Pvt. Ltd. makes no representations as to accuracy, completeness, currentness, suitability, or validity of any information on this site and will not be liable for any errors, omissions, or delays in this information or any losses, injuries, or damages arising from its display or use.”


Related Posts & Blogs
Contemporary businesses are changing at a rate of knots using innovative business solutions to stay afloat. Know more about industry trends, challenges and opportunities in detail after going through an array of exciting blogs.
Read the blogs penned by industry-experts who know the nerve of the business to start your digital transformation journey.

Unleash the potential of Power BI and Business Central Integration....
